Bitcoin Hits Weekly High Near $64,350 Before Pulling Back
Bitcoin touched $64,349 Friday before retreating, but improving technicals suggest bulls still hold the near-term edge.
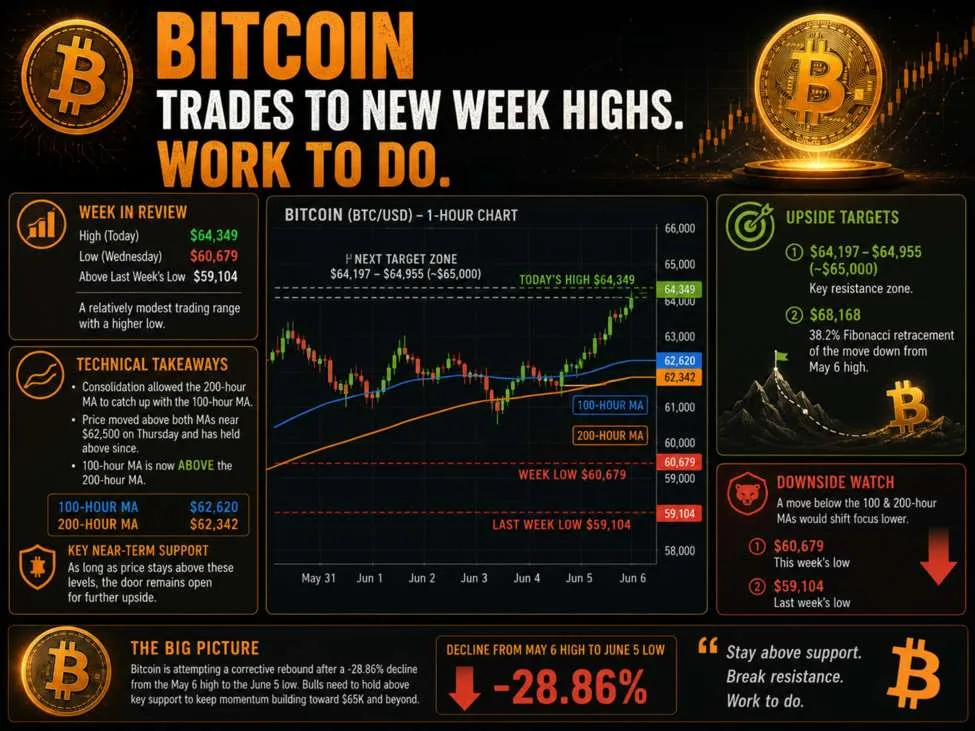
Bitcoin climbed to its best level of the week on Friday, briefly tagging $64,349 before fading, as a broader improvement in risk appetite lifted the cryptocurrency alongside other assets. The week's low of $60,679, set on Wednesday, held comfortably above the prior week's floor of $59,104 — a pattern of higher lows that, while modest, signals a stabilizing mood among traders after months of pressure.
The more consequential development may be what happened beneath the surface on the technical charts. A prolonged consolidation phase allowed Bitcoin's 200-hour moving average to close the gap with the faster 100-hour moving average. On Thursday, Bitcoin broke above both levels clustered near $62,500 and has held that ground. The 100-hour MA has since crossed above the 200-hour MA — the former sitting at $62,620, the latter at $62,342 — a so-called "golden cross" on the hourly timeframe that traders often interpret as a short-term bullish signal. Those two levels now function as the critical floor: as long as Bitcoin trades above them, buying pressure retains structural support heading into the weekend.
Read more Church & Dwight Stock Sits Quiet With No Fresh Catalysts →
The road higher is not without obstacles. The immediate ceiling falls in a zone between roughly $64,200 and $65,000, a range that capped Friday's advance. A convincing close above that band would be meaningful, potentially redirecting trader attention toward the 38.2% Fibonacci retracement of the May-to-June selloff, which arrives near $68,168. Context matters here: Bitcoin shed nearly 29% from its May 6 peak to its June 5 trough, meaning a corrective rally of this magnitude would represent a relatively shallow recovery by historical standards — leaving substantial room to run if momentum builds.
The risk scenario is equally clear-cut. A retreat back below the 100- and 200-hour moving averages would erode the improving technical setup and likely invite a retest of this week's $60,679 low, followed by the more significant $59,104 support level from the prior week. For now, the balance of evidence tilts cautiously toward the bulls, but the margin for error is narrow enough that a single weak session could reset the conversation entirely.
Continue reading at Forexlive.