Bitcoin Falls Into 'BTC Is Dead' Zone on Rainbow Chart
Bitcoin has dropped below a key valuation band on the popular Rainbow Chart, entering territory historically associated with maximum bearish sentiment.
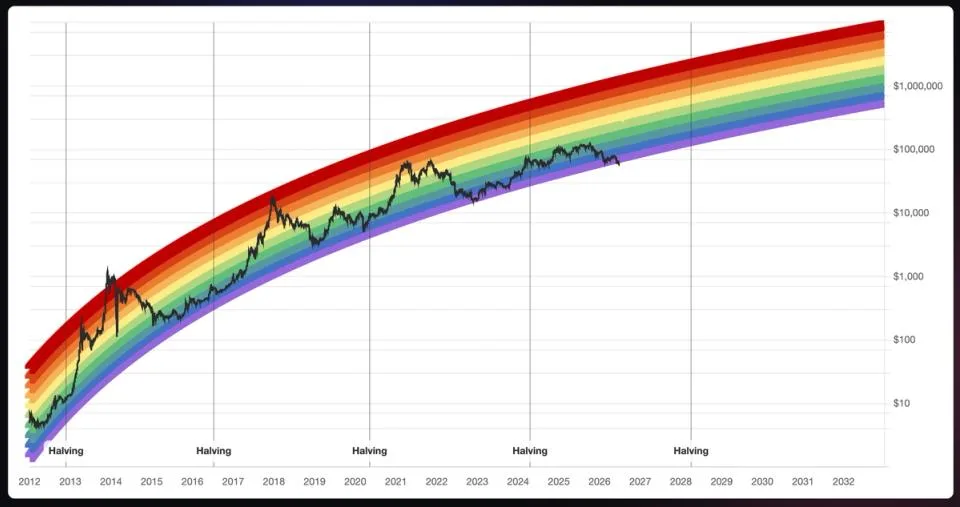
Bitcoin has slipped beneath one of the most closely watched informal valuation tools in crypto markets — the Rainbow Chart — landing in a band that analysts and enthusiasts have long labeled the 'BTC is dead' zone. The move signals that the flagship cryptocurrency has crossed a threshold that, historically, has marked periods of peak pessimism and capitulation among retail investors.
The Rainbow Chart is a logarithmic regression model overlaid with color-coded bands that attempt to contextualize Bitcoin's price relative to its long-term growth trend. Each band carries a colloquial label ranging from 'fire sale' at the bottom to 'maximum bubble territory' at the top. Falling into the lowest band does not imply a fundamental breakdown in the network itself, but it does reflect how dramatically sentiment and price have diverged from the asset's historical trajectory.
Read more Kalshi Eyes $40 Billion Valuation in Prediction Market Surge →
For longer-term Bitcoin observers, entries into the chart's lowest zones have paradoxically coincided with some of the most compelling accumulation opportunities on record. That pattern, however, offers cold comfort to investors holding positions bought at significantly higher prices, and it carries no guarantee that a recovery is imminent or that the model's historical logic will continue to hold.
What makes this moment analytically significant is the broader macro environment surrounding the move. Crypto assets have faced sustained pressure from risk-off sentiment, tighter financial conditions, and lingering uncertainty across global markets — forces that amplify downside moves and can delay the mean-reversion dynamics that Rainbow Chart adherents typically point to as a source of long-term confidence.
Whether this breach represents a generational buying signal or the beginning of a more protracted bear phase remains an open question. What is clear is that Bitcoin's descent into this zone will intensify debate about the asset's near-term floor and the reliability of on-chain valuation frameworks under increasingly complex macro conditions. Continue reading at CoinDesk.